
Stacker compiled a list of the most common birds seen near feeders in Rhode Island using data from the Cornell Lab of Ornithology’s Project FeederWatch. Birds are ranked by the percent of sites visited from Jan 21-Feb 3. Ties are broken by the average group size when seen, any further ties were not broken. Data was collected at 39 count sites in Rhode Island. States with less than 10 count sites were not included in rankings for each bird.
Project FeederWatch, a citizen science project where participants collect data on birds at their feeders, was founded in Ontario by Erica Dunn and the Long Point Bird Observatory in 1976. The project partnered with the Cornell Lab of Ornithology after 10 years to scale the project across the U.S. and Canada and now has over 20,000 participants.
The data Project FeederWatch collects is used by scientists to understand trends in bird populations. If you would like to participate as a FeederWatcher you can learn more about the project here.
Read on to see which birds are most commonly seen in your state.
You may also like: Cities with the fastest-growing home prices in Rhode Island
Canva
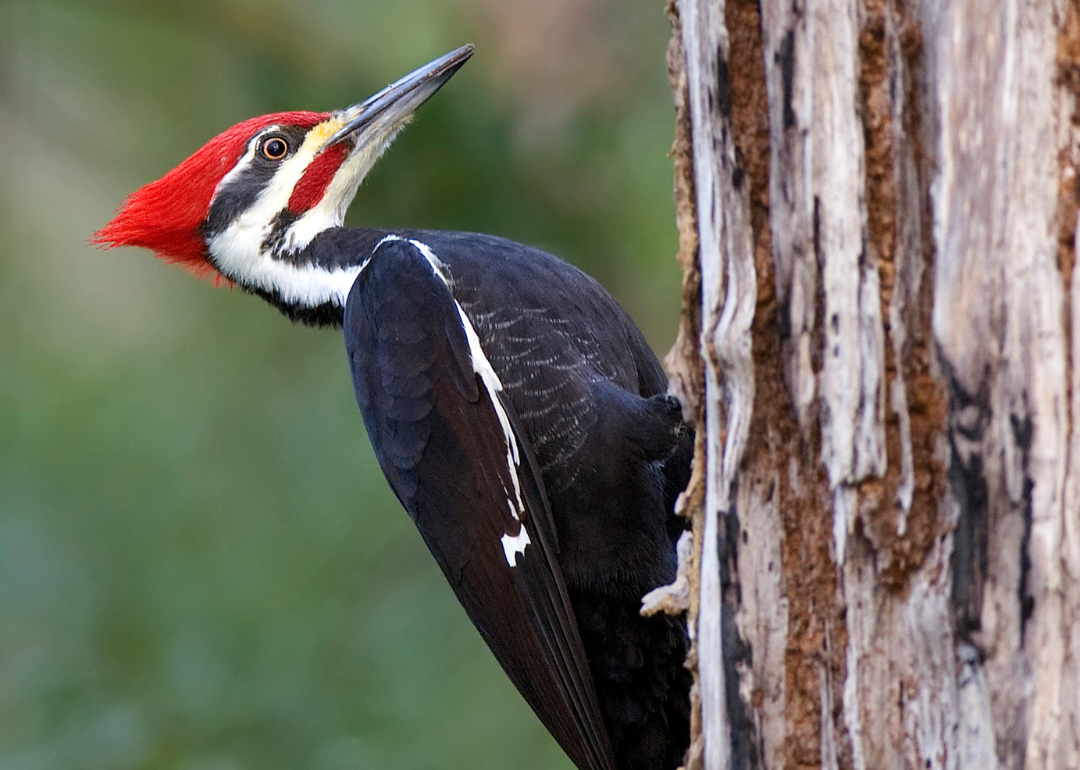
#38. Pileated Woodpecker (tie)
– Sites visited Jan 21-Feb 3: 3%
– Average group size: 1.0
– States with the highest percent of sites visited
— #1. Minnesota: 31%
— #2. Wisconsin: 18%
— #3. West Virginia: 15%
— #3. Indiana: 15%
— #3. Michigan: 15%
Canva
#38. Eastern Towhee
– Sites visited Jan 21-Feb 3: 3%
– Average group size: 1.0
– States with the highest percent of sites visited
— #1. Tennessee: 39%
— #2. Georgia: 38%
— #3. North Carolina: 33%
— #4. South Carolina: 25%
— #5. Alabama: 24%
Canva
#37. Chipping Sparrow
– Sites visited Jan 21-Feb 3: 3%
– Average group size: 1.26
– States with the highest percent of sites visited
— #1. Mississippi: 57%
— #2. South Carolina: 56%
— #3. Georgia: 47%
— #4. Alabama: 39%
— #5. Texas: 35%
Canva
#36. Fox Sparrow
– Sites visited Jan 21-Feb 3: 3%
– Average group size: 1.29
– States with the highest percent of sites visited
— #1. Oregon: 24%
— #2. Washington: 18%
— #3. Oklahoma: 16%
— #4. California: 14%
— #4. Arkansas: 14%
Canva
#35. Brown-headed Cowbird
– Sites visited Jan 21-Feb 3: 3%
– Average group size: 2.06
– States with the highest percent of sites visited
— #1. Mississippi: 36%
— #2. Louisiana: 29%
— #3. South Carolina: 24%
— #4. Texas: 15%
— #4. Tennessee: 15%
You may also like: Counties with the lowest home prices in Rhode Island
Canva
#34. Mallard
– Sites visited Jan 21-Feb 3: 3%
– Average group size: 10.0
– States with the highest percent of sites visited
— #1. South Dakota: 5%
— #2. South Carolina: 4%
— #3. Rhode Island: 3%
— #3. Delaware: 3%
— #3. Maine: 3%
Canva
#29. Yellow-bellied Sapsucker (tie)
– Sites visited Jan 21-Feb 3: 5%
– Average group size: 1.0
– States with the highest percent of sites visited
— #1. Oklahoma: 19%
— #2. Georgia: 18%
— #3. North Carolina: 13%
— #3. South Carolina: 13%
— #5. Tennessee: 12%
Canva
#29. Red-tailed Hawk (tie)
– Sites visited Jan 21-Feb 3: 5%
– Average group size: 1.0
– States with the highest percent of sites visited
— #1. Nevada: 21%
— #2. Delaware: 9%
— #3. Arkansas: 8%
— #4. Iowa: 6%
— #4. Ohio: 6%
Canva
#29. Red-shouldered Hawk (tie)
– Sites visited Jan 21-Feb 3: 5%
– Average group size: 1.0
– States with the highest percent of sites visited
— #1. Florida: 11%
— #2. Oklahoma: 10%
— #3. Virginia: 9%
— #4. Maryland: 8%
— #4. North Carolina: 8%
Canva
#29. Pine Warbler (tie)
– Sites visited Jan 21-Feb 3: 5%
– Average group size: 1.0
– States with the highest percent of sites visited
— #1. Georgia: 56%
— #2. South Carolina: 52%
— #3. Alabama: 43%
— #4. North Carolina: 42%
— #5. Florida: 35%
You may also like: States where people in Rhode Island are getting new jobs
Canva
#29. Brown Creeper
– Sites visited Jan 21-Feb 3: 5%
– Average group size: 1.0
– States with the highest percent of sites visited
— #1. Oklahoma: 16%
— #2. Delaware: 12%
— #2. Kentucky: 12%
— #4. Maine: 10%
— #4. South Dakota: 10%
Canva
#28. Sharp-shinned Hawk
– Sites visited Jan 21-Feb 3: 5%
– Average group size: 1.07
– States with the highest percent of sites visited
— #1. Idaho: 17%
— #2. Utah: 11%
— #3. Washington: 8%
— #3. Nebraska: 8%
— #5. Montana: 7%
Canva
#27. Red-winged Blackbird
– Sites visited Jan 21-Feb 3: 5%
– Average group size: 1.7
– States with the highest percent of sites visited
— #1. Oklahoma: 39%
— #2. Mississippi: 29%
— #2. Louisiana: 29%
— #4. Arkansas: 27%
— #5. Texas: 26%
Canva
#26. American Tree Sparrow
– Sites visited Jan 21-Feb 3: 5%
– Average group size: 1.88
– States with the highest percent of sites visited
— #1. Iowa: 39%
— #2. Michigan: 31%
— #2. Vermont: 31%
— #4. Wisconsin: 30%
— #5. Illinois: 28%
Canva
#25. Canada Goose
– Sites visited Jan 21-Feb 3: 8%
– Average group size: 7.03
– States with the highest percent of sites visited
— #1. Rhode Island: 8%
— #2. Oklahoma: 3%
— #2. South Carolina: 3%
— #4. Kansas: 2%
— #4. Georgia: 2%
You may also like: Best school districts in Rhode Island
Canva
#24. Cooper’s Hawk
– Sites visited Jan 21-Feb 3: 13%
– Average group size: 1.0
– States with the highest percent of sites visited
— #1. Nevada: 29%
— #2. Arizona: 26%
— #3. Illinois: 24%
— #4. Delaware: 18%
— #5. Ohio: 16%
Canva
#23. Purple Finch
– Sites visited Jan 21-Feb 3: 13%
– Average group size: 1.5
– States with the highest percent of sites visited
— #1. Mississippi: 57%
— #2. Oklahoma: 32%
— #3. Arkansas: 30%
— #3. Georgia: 30%
— #5. Alabama: 29%
Canva
#22. Eastern Bluebird
– Sites visited Jan 21-Feb 3: 18%
– Average group size: 1.83
– States with the highest percent of sites visited
— #1. North Carolina: 70%
— #2. Georgia: 64%
— #3. South Carolina: 63%
— #4. Virginia: 51%
— #5. Arkansas: 49%
Canva
#21. American Crow
– Sites visited Jan 21-Feb 3: 18%
– Average group size: 2.64
– States with the highest percent of sites visited
— #1. Oklahoma: 48%
— #2. Arkansas: 46%
— #3. Maine: 42%
— #4. North Carolina: 36%
— #5. Florida: 32%
Canva
#20. Red-breasted Nuthatch
– Sites visited Jan 21-Feb 3: 21%
– Average group size: 1.31
– States with the highest percent of sites visited
— #1. Maine: 67%
— #2. Alaska: 56%
— #3. South Dakota: 50%
— #4. Montana: 49%
— #4. Washington: 49%
You may also like: Countries Rhode Island exports the most goods to
Canva
#19. American Robin
– Sites visited Jan 21-Feb 3: 28%
– Average group size: 2.32
– States with the highest percent of sites visited
— #1. Nevada: 64%
— #2. Oklahoma: 52%
— #3. Arkansas: 51%
— #4. New Mexico: 49%
— #5. Tennessee: 48%
Canva
#18. Northern Flicker
– Sites visited Jan 21-Feb 3: 33%
– Average group size: 1.28
– States with the highest percent of sites visited
— #1. Montana: 72%
— #2. Colorado: 65%
— #3. Washington: 64%
— #4. Oregon: 60%
— #5. Nevada: 57%
Canva
#17. Hairy Woodpecker
– Sites visited Jan 21-Feb 3: 41%
– Average group size: 1.3
– States with the highest percent of sites visited
— #1. Vermont: 72%
— #2. Maine: 67%
— #3. New Hampshire: 66%
— #4. Minnesota: 61%
— #5. Connecticut: 60%
Canva
#16. European Starling
– Sites visited Jan 21-Feb 3: 44%
– Average group size: 3.38
– States with the highest percent of sites visited
— #1. Indiana: 76%
— #2. Ohio: 70%
— #3. Missouri: 69%
— #4. Delaware: 58%
— #5. Kansas: 56%
Canva
#15. Song Sparrow
– Sites visited Jan 21-Feb 3: 46%
– Average group size: 1.55
– States with the highest percent of sites visited
— #1. Washington: 60%
— #2. Oregon: 52%
— #3. Rhode Island: 46%
— #4. West Virginia: 39%
— #5. Virginia: 37%
You may also like: Highest-rated things to do in Rhode Island, according to Tripadvisor
Canva
#14. White-throated Sparrow
– Sites visited Jan 21-Feb 3: 51%
– Average group size: 1.99
– States with the highest percent of sites visited
— #1. Arkansas: 76%
— #2. Maryland: 75%
— #3. Delaware: 73%
— #4. New Jersey: 69%
— #5. Virginia: 68%
Canva
#13. House Sparrow
– Sites visited Jan 21-Feb 3: 54%
– Average group size: 5.23
– States with the highest percent of sites visited
— #1. South Dakota: 90%
— #2. Illinois: 87%
— #3. Iowa: 82%
— #4. Indiana: 79%
— #5. Nebraska: 74%
Canva
#12. Carolina Wren
– Sites visited Jan 21-Feb 3: 62%
– Average group size: 1.17
– States with the highest percent of sites visited
— #1. South Carolina: 88%
— #2. North Carolina: 86%
— #3. Georgia: 80%
— #3. Virginia: 80%
— #5. Maryland: 79%
Canva
#11. House Finch
– Sites visited Jan 21-Feb 3: 62%
– Average group size: 3.61
– States with the highest percent of sites visited
— #1. Utah: 97%
— #2. Arizona: 95%
— #3. New Mexico: 88%
— #3. Kansas: 88%
— #3. Delaware: 88%
Canva
#10. Red-bellied Woodpecker
– Sites visited Jan 21-Feb 3: 64%
– Average group size: 1.13
– States with the highest percent of sites visited
— #1. West Virginia: 87%
— #2. New Jersey: 80%
— #3. Ohio: 79%
— #4. Connecticut: 78%
— #4. Kentucky: 78%
You may also like: Zip codes with the most expensive homes in Rhode Island
Canva
#9. Blue Jay
– Sites visited Jan 21-Feb 3: 67%
– Average group size: 2.54
– States with the highest percent of sites visited
— #1. Oklahoma: 81%
— #2. Nebraska: 79%
— #3. Ohio: 77%
— #4. Massachusetts: 75%
— #4. New Jersey: 75%
Canva
#8. American Goldfinch
– Sites visited Jan 21-Feb 3: 67%
– Average group size: 2.97
– States with the highest percent of sites visited
— #1. Mississippi: 93%
— #2. West Virginia: 83%
— #3. Oklahoma: 81%
— #4. Arkansas: 78%
— #5. Michigan: 76%
Canva
#7. Mourning Dove
– Sites visited Jan 21-Feb 3: 72%
– Average group size: 4.56
– States with the highest percent of sites visited
— #1. West Virginia: 91%
— #2. New Jersey: 88%
— #3. Kentucky: 84%
— #4. South Carolina: 81%
— #5. Pennsylvania: 80%
Canva
#6. White-breasted Nuthatch
– Sites visited Jan 21-Feb 3: 79%
– Average group size: 1.49
– States with the highest percent of sites visited
— #1. West Virginia: 85%
— #2. Michigan: 84%
— #3. Connecticut: 83%
— #4. New Hampshire: 82%
— #4. Maryland: 82%
Canva
#5. Downy Woodpecker
– Sites visited Jan 21-Feb 3: 79%
– Average group size: 1.65
– States with the highest percent of sites visited
— #1. Arkansas: 92%
— #2. Connecticut: 91%
— #2. Iowa: 91%
— #2. West Virginia: 91%
— #5. Minnesota: 89%
You may also like: Where people in Rhode Island are moving to most
Canva
#4. Tufted Titmouse
– Sites visited Jan 21-Feb 3: 85%
– Average group size: 2.76
– States with the highest percent of sites visited
— #1. Connecticut: 92%
— #2. West Virginia: 91%
— #3. North Carolina: 89%
— #4. Virginia: 86%
— #4. Georgia: 86%
Canva
#3. Northern Cardinal
– Sites visited Jan 21-Feb 3: 87%
– Average group size: 2.3
– States with the highest percent of sites visited
— #1. Arkansas: 97%
— #2. Georgia: 95%
— #3. Oklahoma: 94%
— #3. Kentucky: 94%
— #3. Maryland: 94%
Canva
#2. Black-capped Chickadee
– Sites visited Jan 21-Feb 3: 92%
– Average group size: 2.55
– States with the highest percent of sites visited
— #1. Minnesota: 97%
— #2. Vermont: 95%
— #2. Maine: 95%
— #2. Connecticut: 95%
— #5. Alaska: 94%
Canva
#1. Dark-eyed Junco
– Sites visited Jan 21-Feb 3: 95%
– Average group size: 4.4
– States with the highest percent of sites visited
— #1. Oklahoma: 97%
— #2. Missouri: 95%
— #2. Rhode Island: 95%
— #2. Arkansas: 95%
— #5. Washington: 94%
